ImpactReport™
ESG-Report
Globe Systems A/S
CVR DK 25986679

Complied in accordance with the EU's voluntary standard - VSME


46.50: Wholesale of information and communication equipment

19 August 2025Download PDFShare report
Virksomhedslogo
Foundation of the Report
Voluntary Reporting
Globe Systems A/S operates within the IT industry, a sector that is a key player in the development and distribution of the digital infrastructure on which modern society is built. Although we are not directly subject to the current mandatory ESG reporting requirements, we have made a voluntary decision to prepare this ESG report.
This decision is driven by our desire to take responsibility – not only for the physical distribution of technology but also for the consequences and opportunities that accompany digitalization. As an actor in the value chain, we have both influence and responsibility to promote digital solutions that support more sustainable, ethically sound, and socially responsible outcomes.

Framework and Methodology for ESG Reporting and CO₂ Accounting
To ensure transparency and comparability in our ESG reporting and CO₂ accounting, we base our work on recognized standards and guidelines. Our approach is built on the following methodological and organizational framework:
  • Organizational and Operational Boundaries:
    This report covers the entirety of Globe Systems A/S and includes all activities and locations under our operational control. This includes our headquarters and warehouse facilities located at Pi 2, 8382 Hinnerup, Denmark, as well as data from our satellite office at Kirkebjerg Allé 86A, 2605 Brøndby, Denmark. Since we lease office space at the Brøndby location, consumption and CO₂e impact have been estimated based on average values. This is done to present the most accurate picture of Globe Systems A/S’s total consumption. The reporting follows the EU’s voluntary VSME standard, where we include emissions and consumption from locations which we have direct influence over. 

  • Data Sources and Documentation:
    Data has been collected from a variety of internal and external sources, including:
    • Internal accounting and HR systems
    • Electricity, heating, and mileage records
    • Information from suppliers
    • Manual calculations of transport, consumption, and waste
All data is documented and stored for verification and auditing purposes.

Methodological Considerations and Calculation Basis
The CO₂e calculations are prepared in accordance with the Greenhouse Gas Protocol (GHG Protocol) and cover Scope 1, 2, and selected Scope 3 emissions where relevant data is available. To calculate our carbon footprint, we used Valified’s CO₂ calculator, which is based on the 2023 version (v2) of the Danish Business Authority’s tool Klimakompasset. Klimakompasset uses emissions factors aligned with the latest international guidelines, including those from DEFRA and the IPCC.
Where assumptions were necessary (e.g., estimated fuel consumption or missing supplier data), they have been clearly noted and are based on conservative estimates to avoid underreporting.

Transparency and Continuous Improvement
We strive for high transparency and continuously work to improve data quality and expand our ESG reporting. We are aware of limitations in our current data collection – particularly concerning Scope 3 – and aim to enhance both measurement and documentation in the coming years.

Scope of the Report
The report primarily covers the year 2024 but also provides insights into our data from 2022 and 2023. This is intended to offer the most accurate view of how we, as a company, are evolving – either toward or away from being a more sustainable business, both now and in the future.
We see ESG reporting as a tool to:
  • Strengthen transparency in our business
  • Document and improve our efforts in areas such as climate, working conditions, and business ethics
  • Contribute to a digital future where responsibility and sustainability go hand in hand with technological development
At the same time, we want to support the development of future-proof solutions in the industry – for example, by collaborating with suppliers on environmentally friendly products, responsible data management, and circular handling of IT equipment.
To us, digital responsibility is not just about compliance but about actively making decisions that positively impact both society and our customers’ ability to run responsible, digitally driven businesses – for instance, through initiatives like Globe Systems Refurb. We recognize, however, that this is an ongoing process and that one initiative alone is not enough.

This report is therefore both a status update and a starting point – part of our continued efforts to integrate ESG as a natural component of our business strategy and value creation.
Virksomhedslogo
A Message from Management 
"At Globe Systems A/S, we believe that long-term business success goes hand in hand with responsibility toward people, the environment, and society. Sustainability has evolved from being a separate focus area to becoming an integrated part of our strategy, culture, and daily operations.
This report marks an important milestone in our journey toward greater transparency and improved ESG performance. We are proud of the progress we have already made – including our work with circular business models, green energy, increased employee well-being, and improved data quality. At the same time, we recognize that there is still significant room – and responsibility – for further improvement.
In 2025, we will intensify our efforts on multiple fronts: from further reducing our CO₂e footprint and expanding the Refurb program, to strengthening supplier responsibility and increasing employee engagement in the green transition.
We see sustainability as an ongoing process – not a fixed goal. And we are committed to learning, adapting, and growing along the way.
Thank you to our employees, customers, partners, and stakeholders for your trust and collaboration. Together, we are building a more responsible and future-ready business."
Dennis Ravnborg, CEO
Globe Systems A/S
Virksomhedslogo
A Sustainable Future
At Globe Systems, sustainability is an integrated part of our business development – for the benefit of the environment, people, and the long-term value we deliver to our customers. Sustainability is not just a goal but a continuous process in which we constantly assess how our solutions and operations can become more responsible and resource-efficient.
Our ambition is to support our customers' businesses with technological solutions that have a lower environmental impact, longer product lifespans, and are produced under proper social and ethical conditions. This means, among other things, that we aim to:
  • minimize the CO₂ footprint across the entire product lifecycle,
  • require our suppliers to comply with ethical standards, and
  • prioritize partnerships with companies that share our focus on social and environmental responsibility.

A concrete initiative in this direction is Globe Systems Refurb, where we work to extend the lifespan of equipment by refurbishing and reselling returned products. The goal is to reduce both CO₂ emissions and the amount of electronic waste. Throughout 2025, we are working to establish measurable indicators for how much equipment we can regenerate and what environmental impact it has.
Another initiative is the optimization of product shipments through so-called consolidated packaging. Where possible, we combine multiple customer orders into a single shipment to reduce the amount of packaging and minimize transport between our company and the customer. In practice, this means waiting to pack the day’s orders until the end of the day. We do this without compromising on delivery times or service quality.
We recognize that working with sustainability is complex and involves both dilemmas and areas for development. Therefore, we see this report and our initiatives as steps along the way – and we will continue to improve and document our results to ensure transparency and credibility.
Virksomhedslogo
Globe Systems Refurb
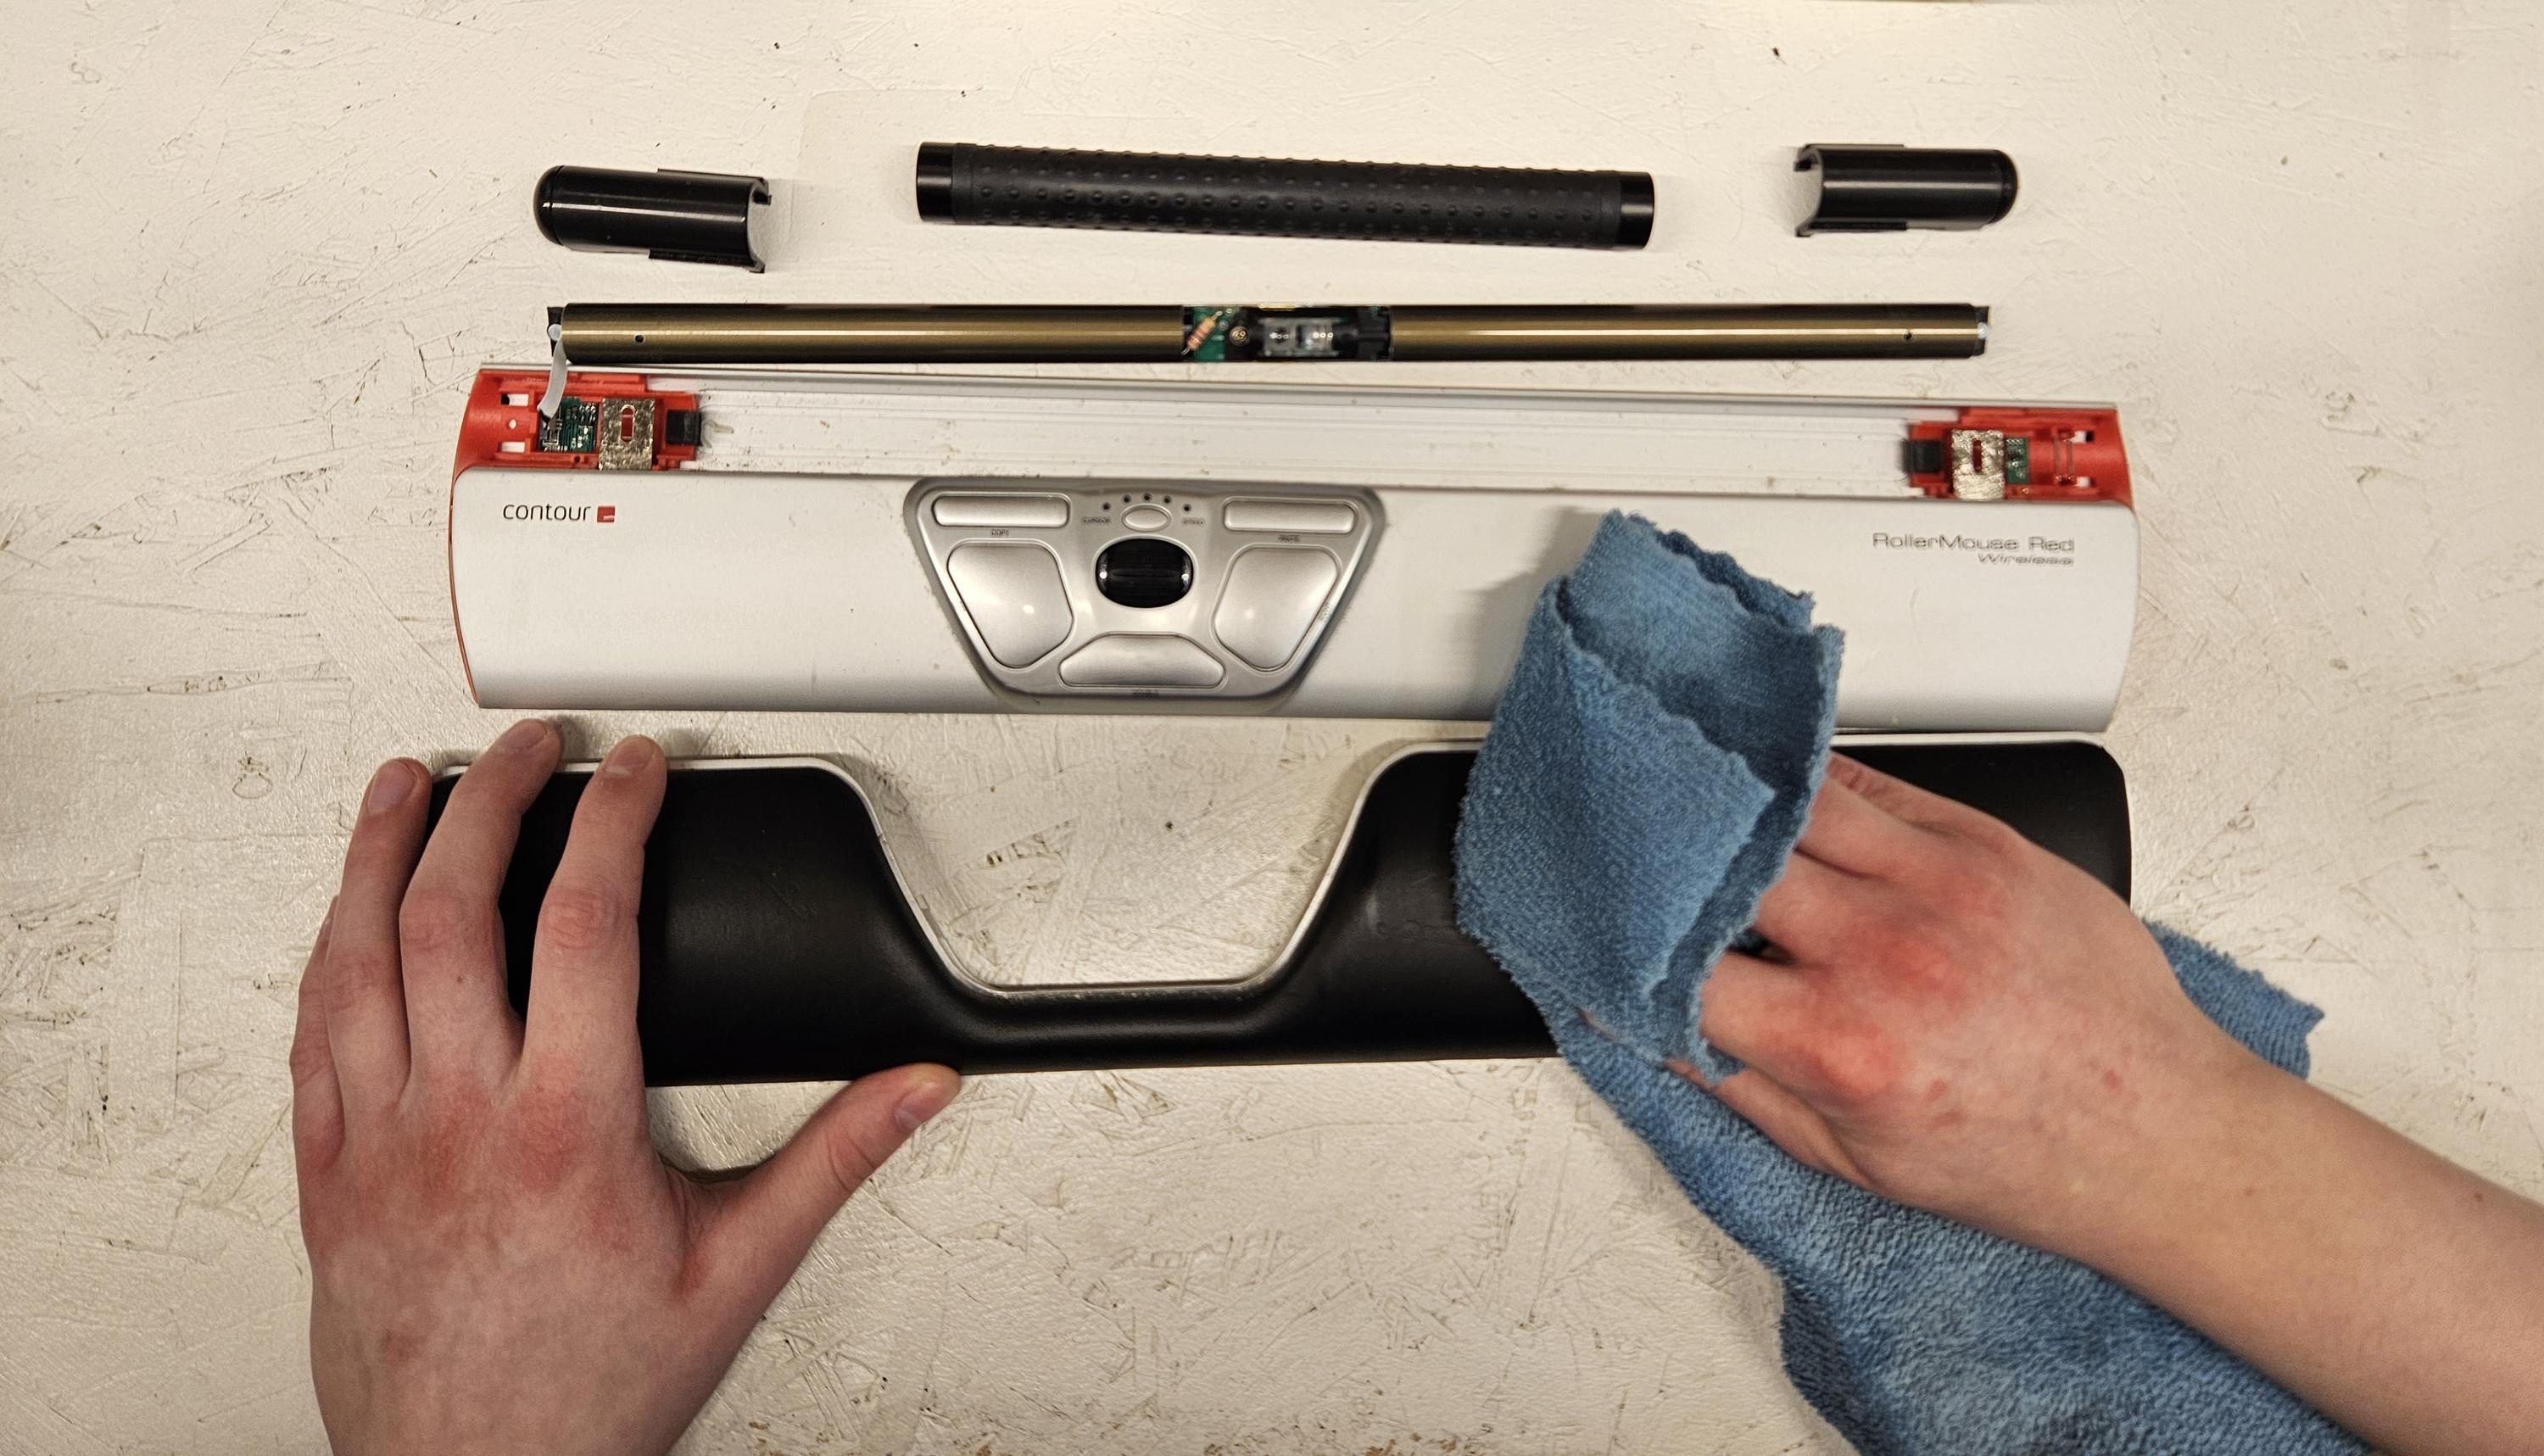
  • With Globe Systems Refurb, we actively work to extend the lifespan of IT equipment and reduce electronic waste. The Refurb program is our tangible contribution to the circular economy: instead of sending used equipment to disposal, we receive it back from our customers, assess its quality, refurbish it, and reintroduce it to the market.
  • Refurb is an alternative to buying new and can significantly reduce the environmental impact per unit, as the production of new equipment typically results in considerable CO₂ emissions. In 2025, we aim to document the average environmental savings per refurbished unit in collaboration with our suppliers.
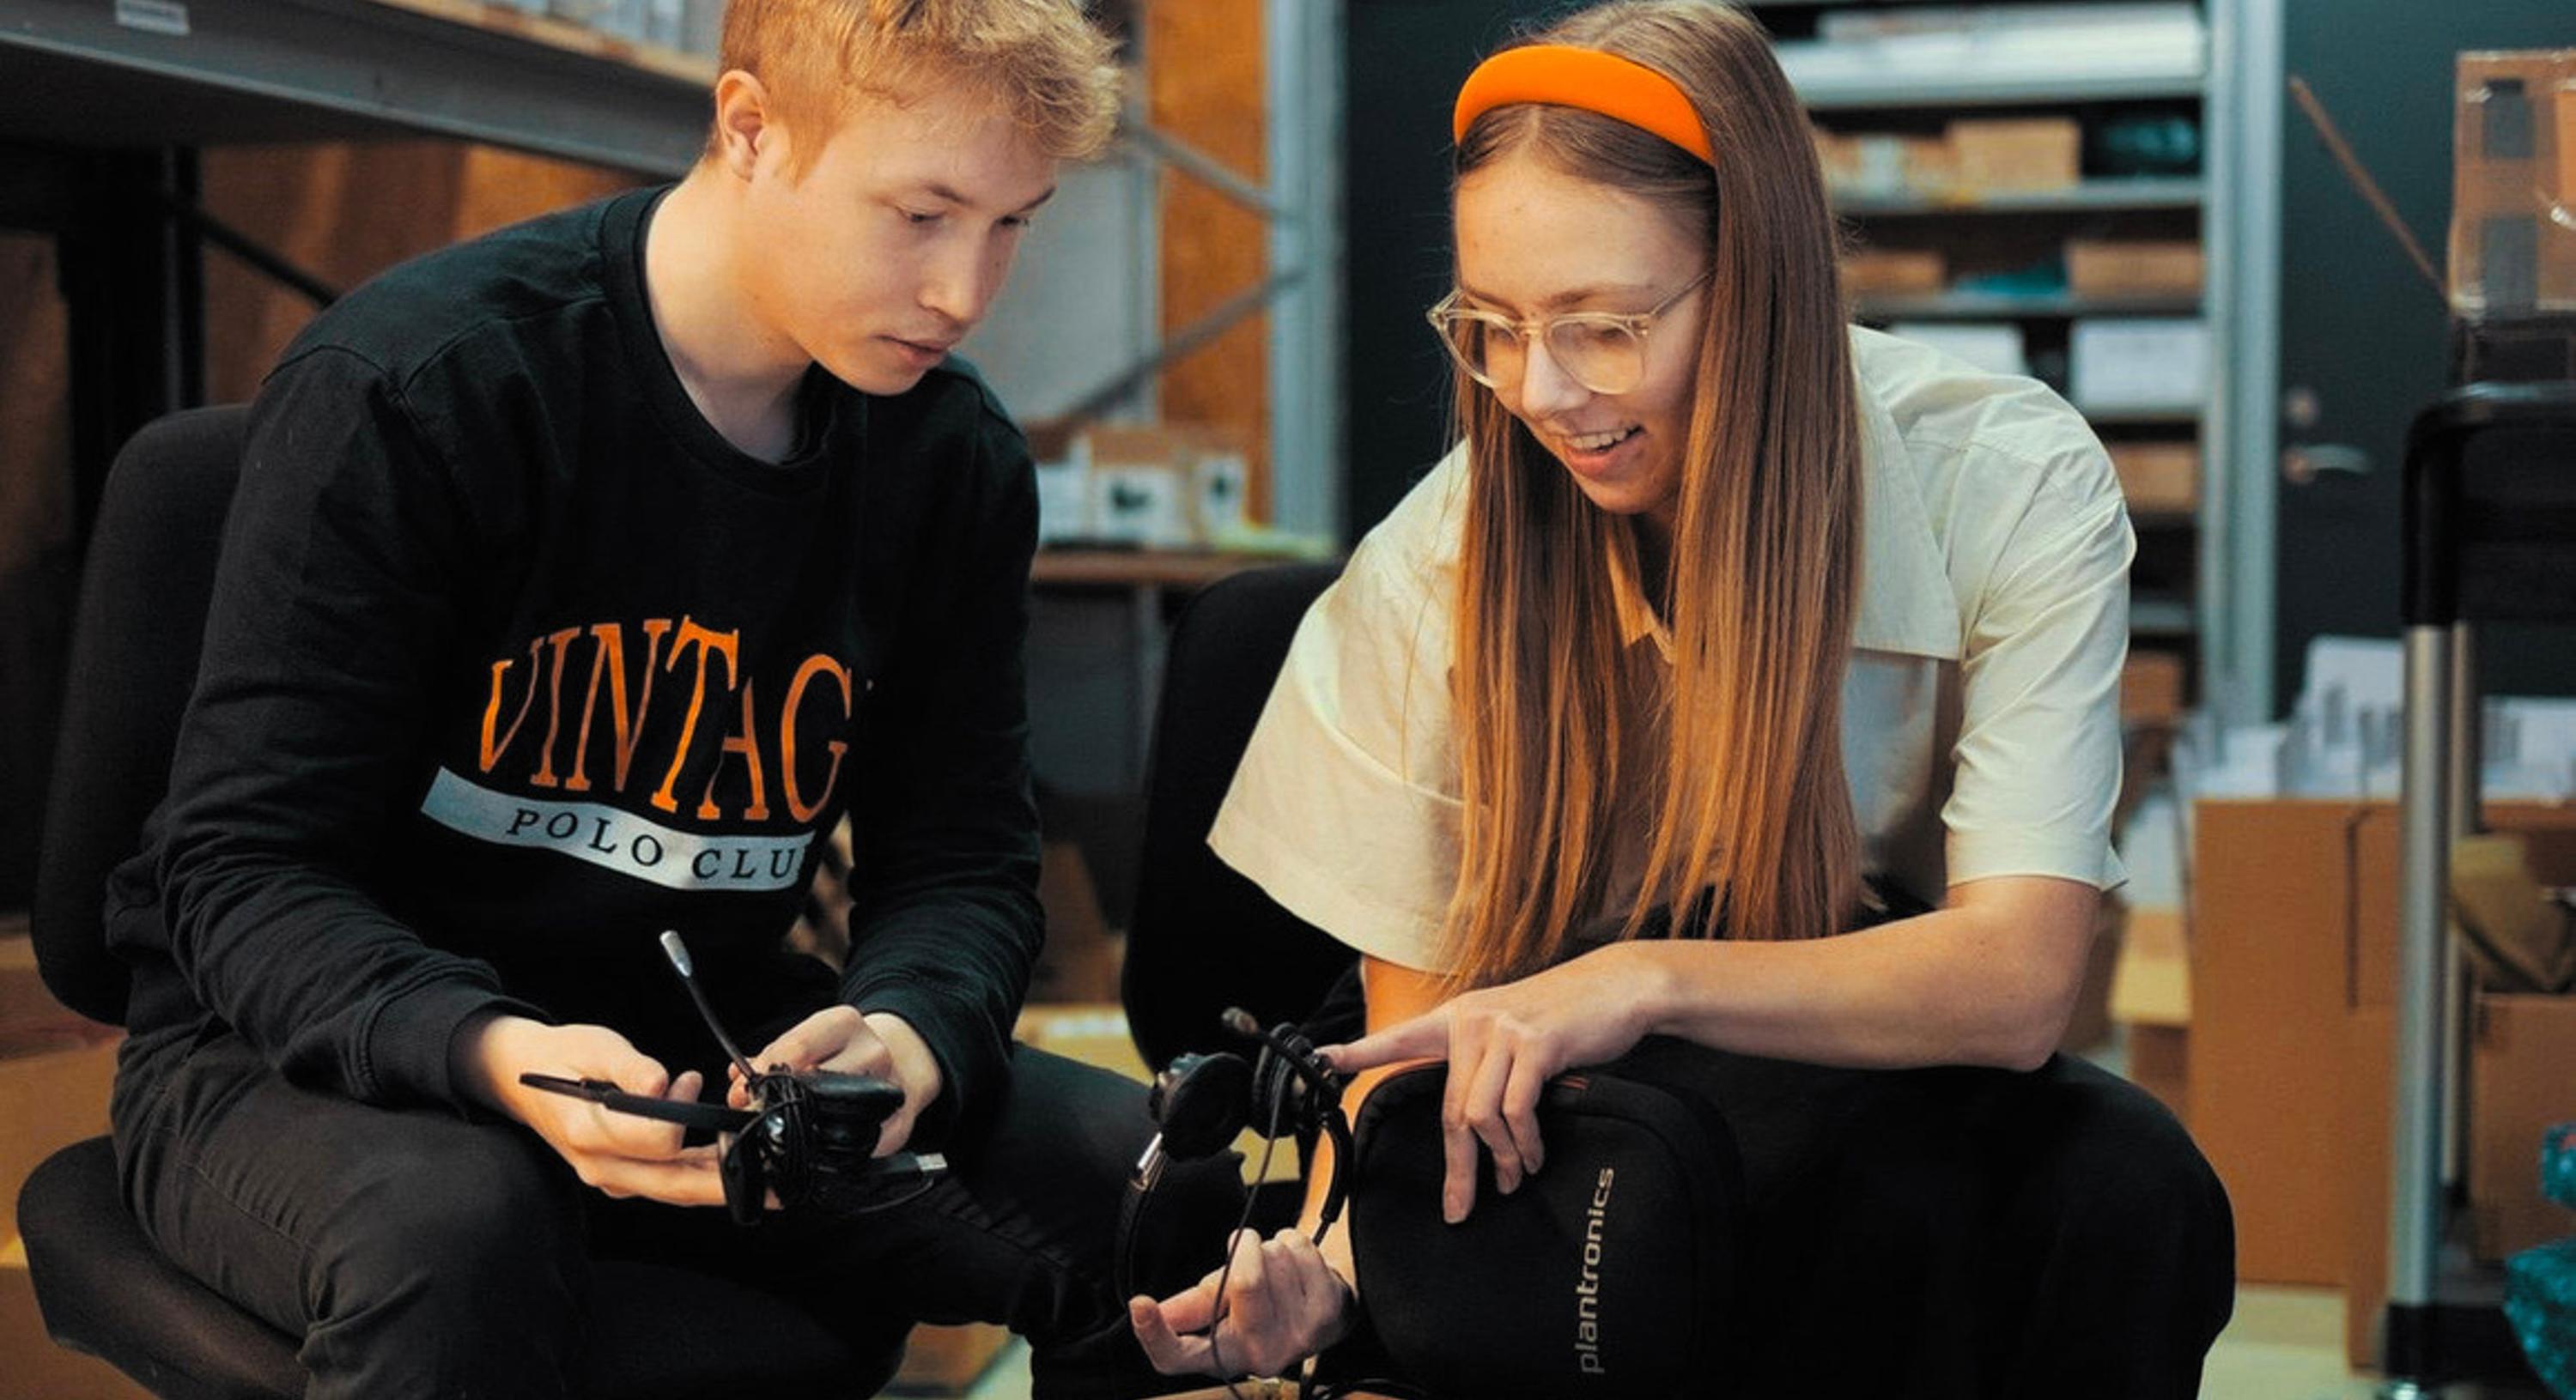
  • The Refurb process is carried out in close partnership with Special Minds, a social enterprise. Here, the equipment is prepared for resale by employees on the autism spectrum, working under structured and supportive conditions. This collaboration supports both environmental and social sustainability.
Virksomhedslogo
Virksomhedslogo
Certifications
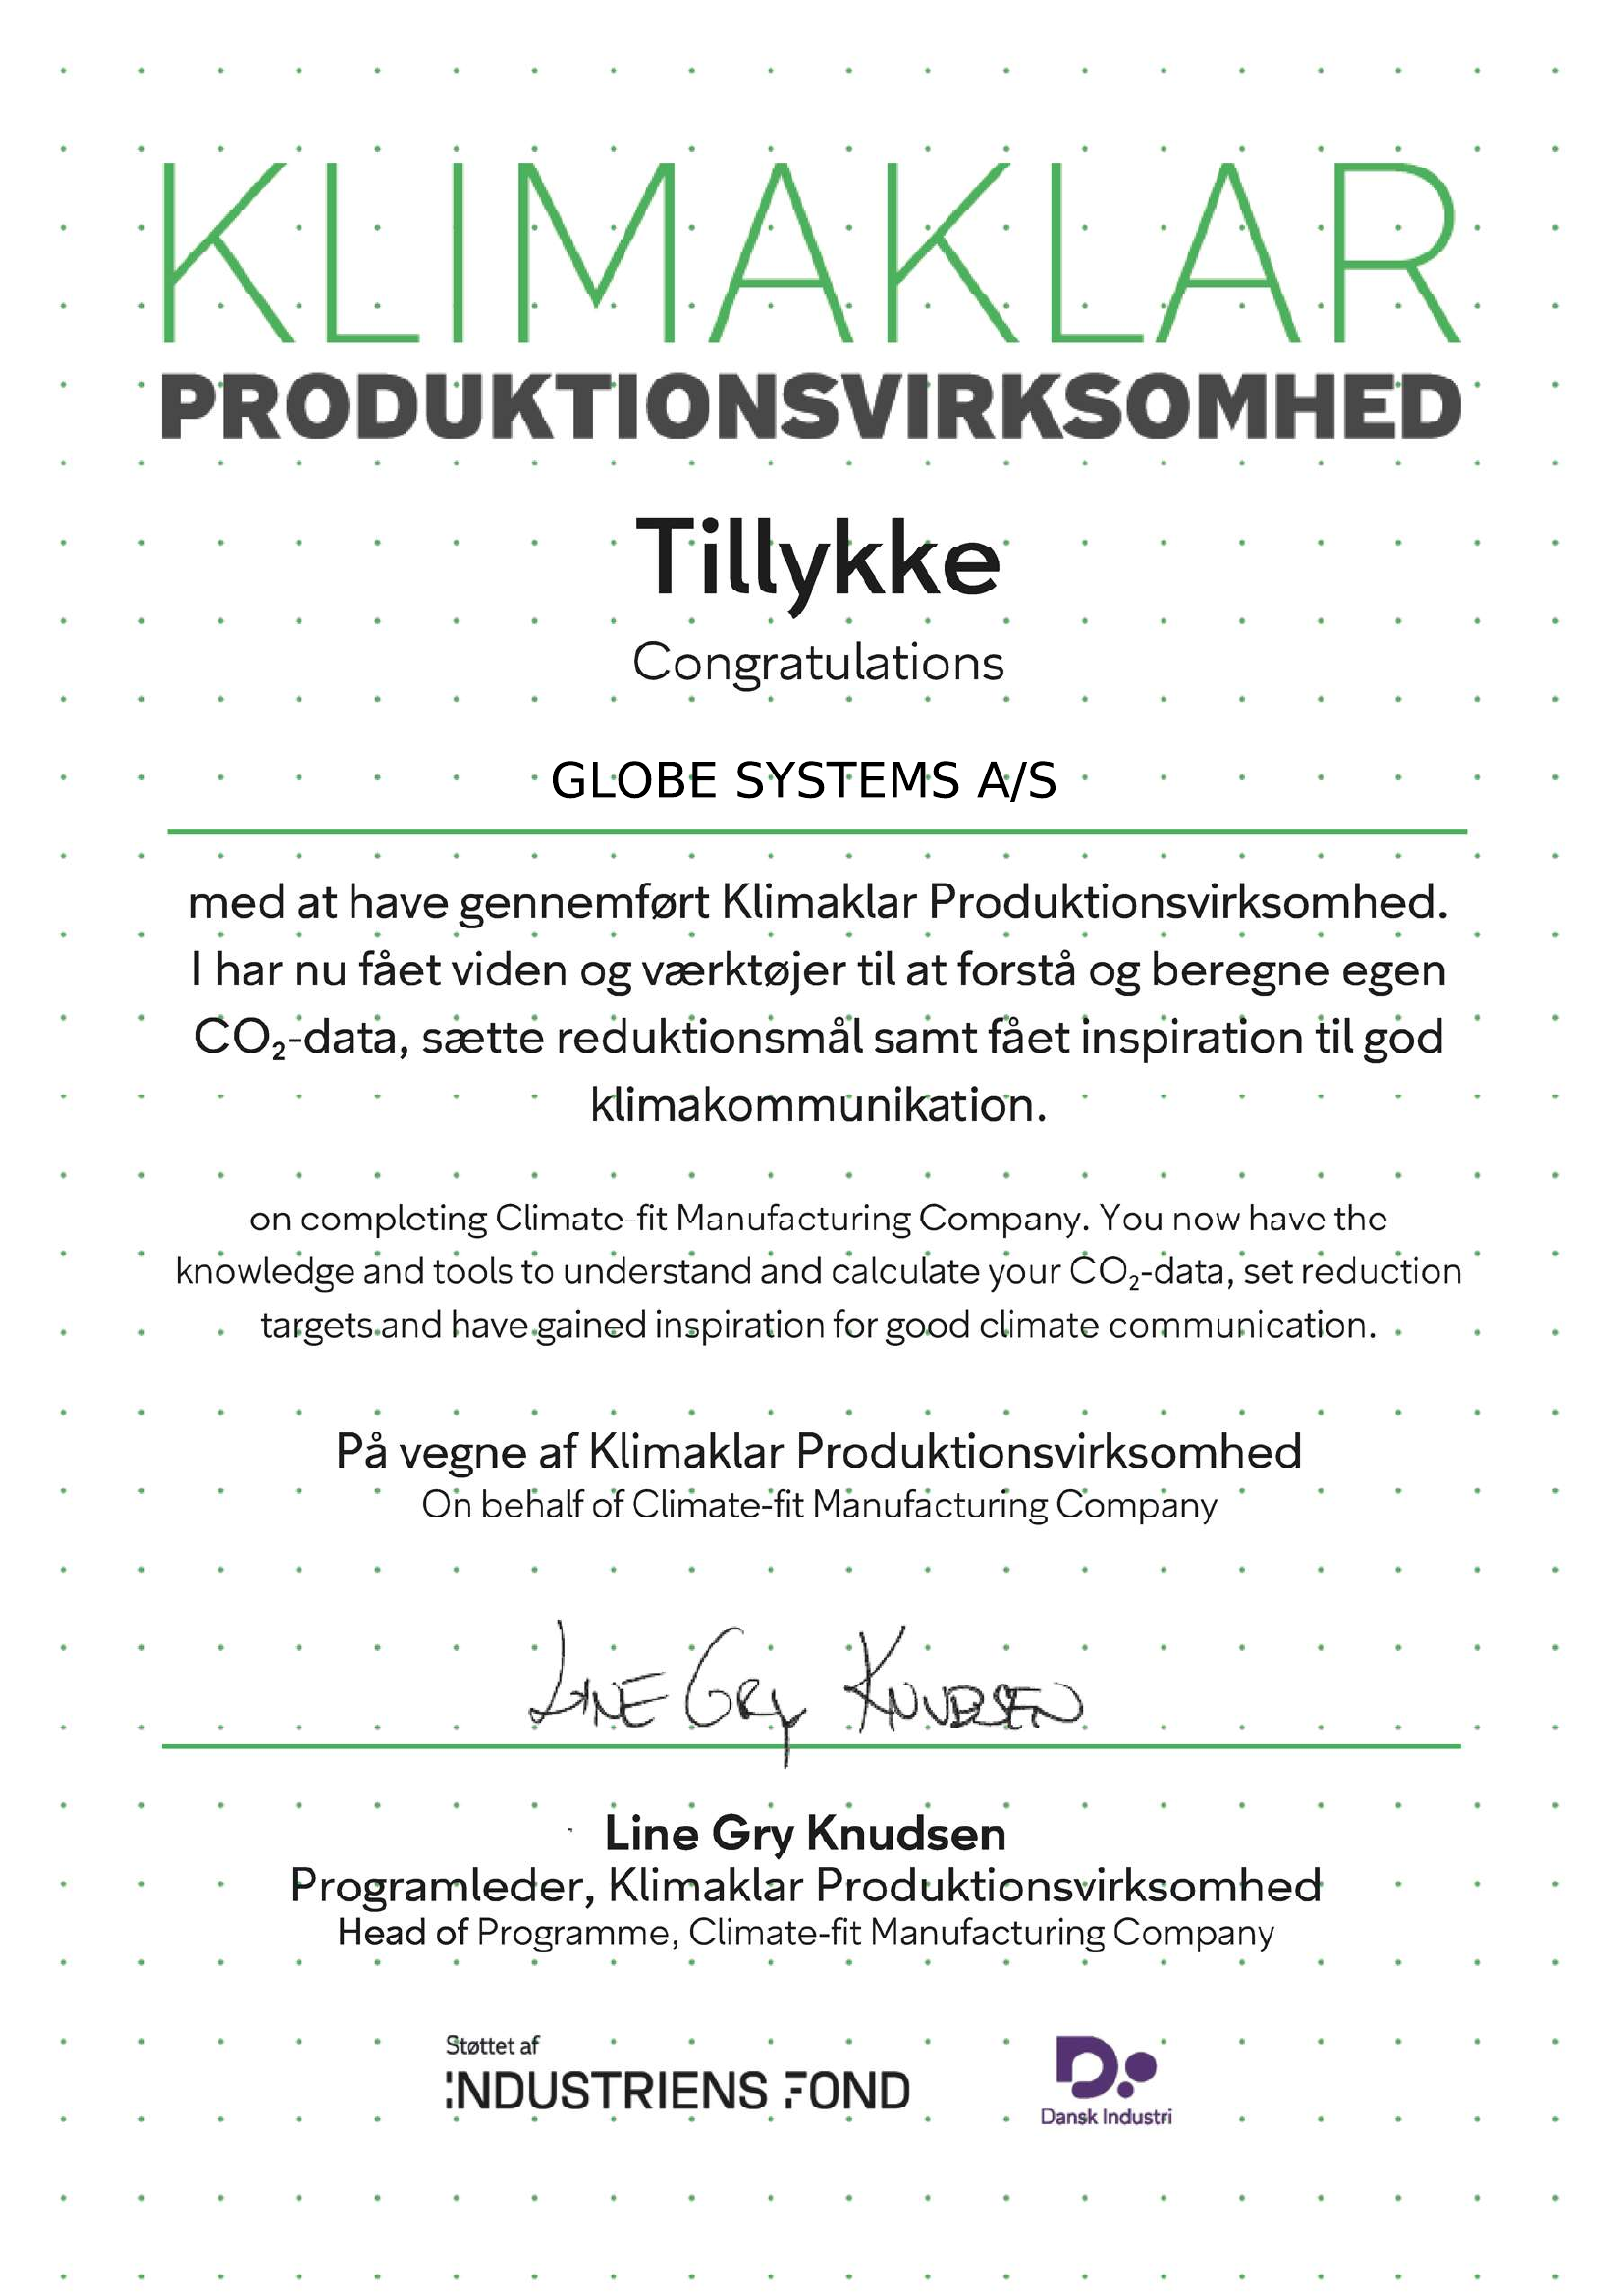
At present, we are not certified under any ESG or sustainability standards. However, we recognize the value of external validation and transparent measurement systems, and we intend to explore relevant certification schemes that can support our efforts – especially as the company grows and the need for standardized reporting increases.
Although we are not yet certified, we have initiated several measures that promote environmental and social responsibility. These include:
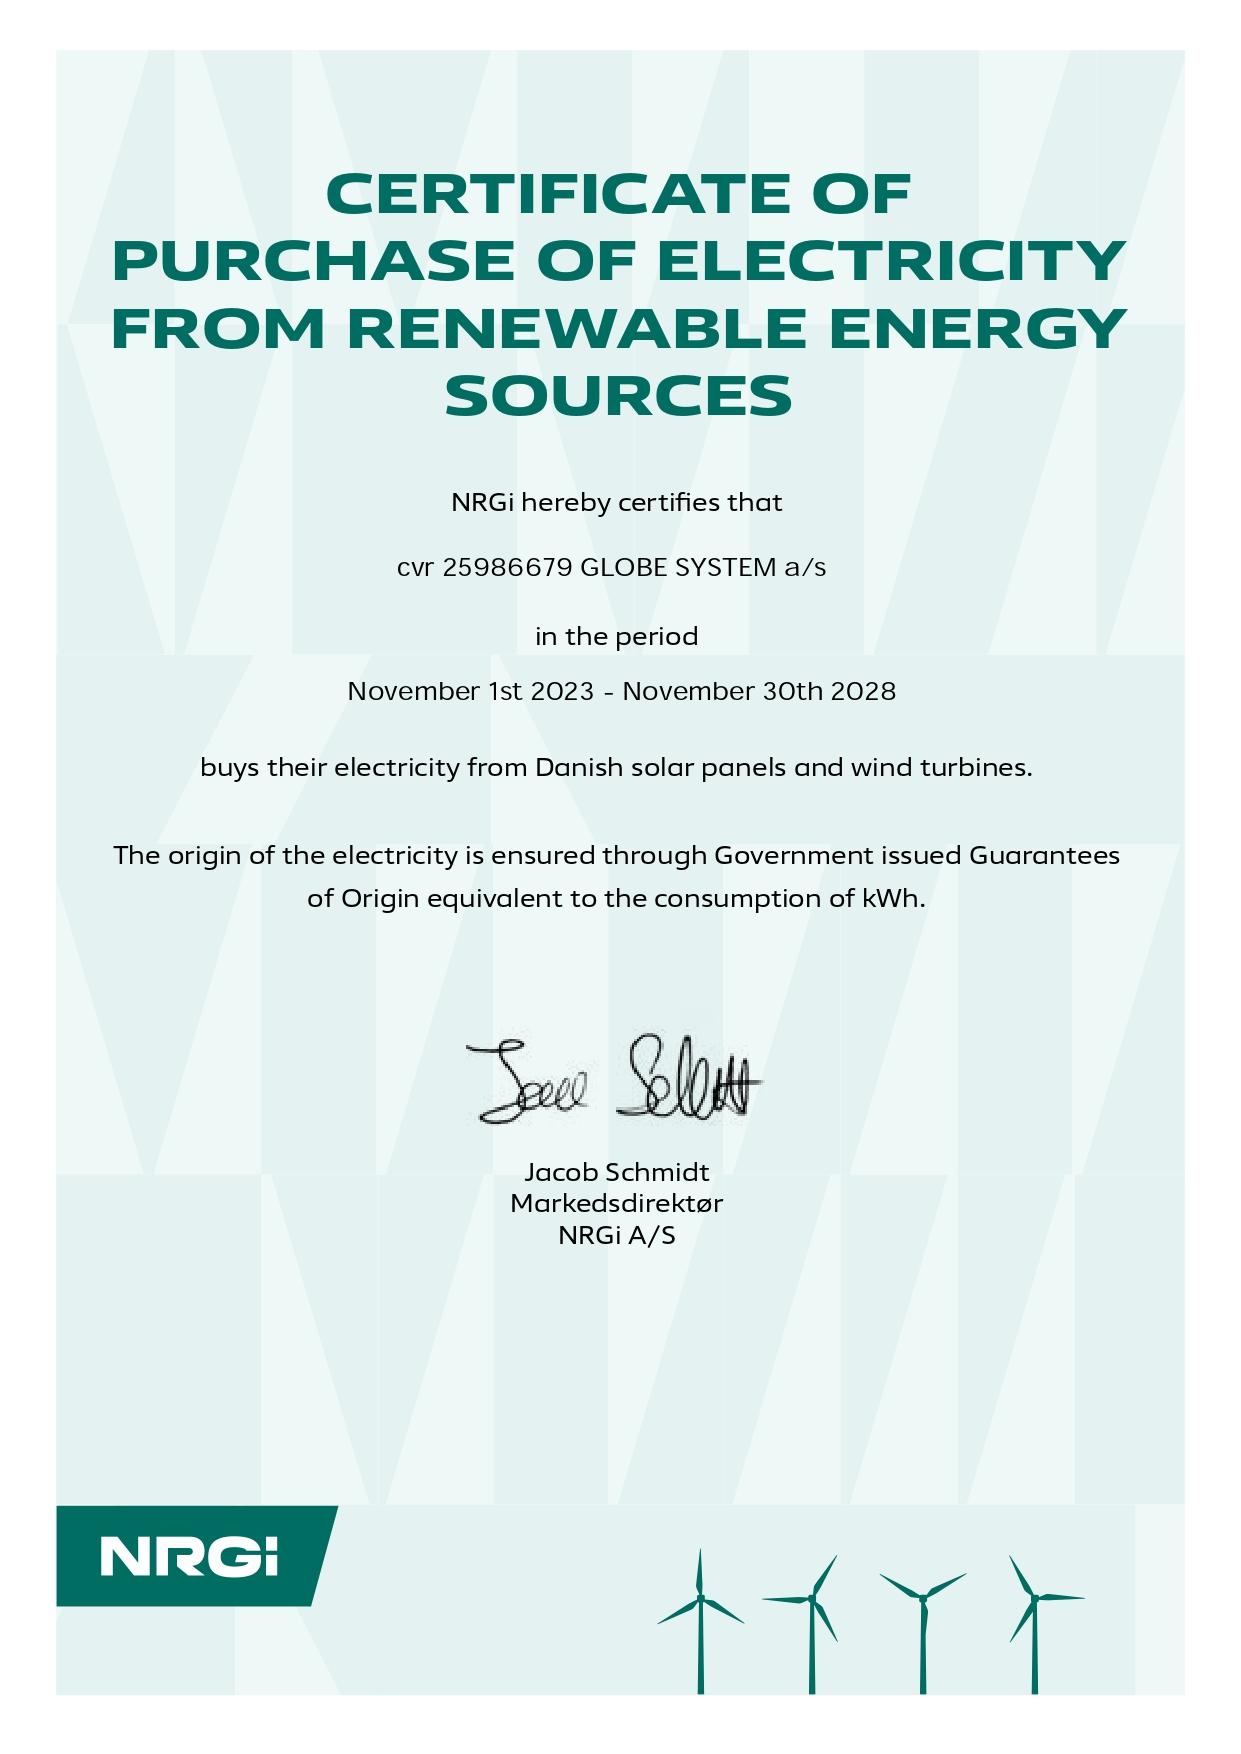
  • the use of 100% green electricity at our headquarters,
  • the implementation of Globe Systems Refurb, which aims to extend the lifespan of IT equipment,
  • the optimization of packaging and transport through consolidated shipping solutions.
These initiatives are integrated into our business strategy and are intended to serve as a foundation for more structured ESG work moving forward.
Virksomhedslogo
Our Approach to Sustainability – Present and Past 
See Appendix 1 for an overview of the areas where we have established policies, targets, and planned initiatives.

In addition to our business-driven efforts, we have implemented a range of policies that support sustainability and help reduce our environmental impact. We place strong emphasis on labor rights, fair wages, safe working conditions, and fostering a diverse and inclusive workplace. Specific examples of our initiatives are presented throughout this report and are linked to relevant UN Sustainable Development Goals.
As shown in the tables below, we have progressed from not actively integrating sustainability into our business in 2022 to making it a core part of our mission and business strategy today – through initiatives such as Globe Systems Refurb and Consolidated Packaging.

We continuously work to reduce our own CO₂e footprint, while also focusing on how we can contribute to broader efforts to reduce emissions on both a national and global scale – because we recognize that sustainability is a shared responsibility.
Sustainability in Vision, Strategy, and Core Values 
The table below illustrates how we have gradually increased our focus on sustainability across the company since 2022. We believe it is essential to integrate sustainability directly into our strategy—so that it becomes more than just a part of our communication and is reflected in the concrete actions and decisions we make. 

Bæredygtighed i vision, strategi eller værdigrundlag

202220232024
Sustainability is written into our vision, strategy, or values.
–
–
We are working on sustainability, but it is not written into our vision, strategy, or values foundation.
–
–
We are not working on sustainability, but we plan to do so in the future
–
–
We do not work with sustainability
–
–
–
Virksomhedslogo
Sustainability in Vision, Strategy, and Core Values  - Continued
The table below provides a more detailed overview of the specific areas where we have progressively expanded our focus over the past three years. 

Politikker eller initiativer for områder der bidrager til bæredygtig omstilling

202220232024
Climate change
–
Pollution
Water and marine resources
–
–
–
Biodiversity and ecosystems
–
–
–
Circular economy
Own workforce
–
–
–
Workers in the value chain
–
–
–
Affected communities
–
–
–
Consumers and end users
–
Corporate governance
–
–
Virksomhedslogo

Energy consumption

242Exact number: 241.965

MWh

2024

Energy consumption from fossil sources

216Exact number: 215.78900000000002

MWh

2024

Share of renewable electricity consumption.

88%

2024

Energy Consumption 
We are continuously working to reduce our resource consumption and improve energy efficiency across our operations. Since 2023, our headquarters in Hinnerup has exclusively sourced electricity from renewable energy through a green energy agreement. This is one of several initiatives aimed at reducing our overall climate footprint.
Other measures include:
  • Replacing lighting with energy-efficient LED bulbs,
  • Installing motion sensors to avoid unnecessary energy use,
  • Raising employee awareness around daily energy habits.
We acknowledge that a significant share of our total energy consumption in 2024 still comes from fossil sources – particularly at our Brøndby location, where it has not yet been possible to switch to green electricity. Our goal is to reduce the proportion of fossil energy sources by 2030, in line with technological and market developments that make the transition feasible.
An important step in this direction is the gradual replacement of our vehicle fleet. Starting in 2025, we will begin transitioning from fossil-fueled to 100% electric company cars and will continuously document the progress as part of our climate reporting.
Virksomhedslogo
Energy Consumption  -  Historically
Below is the distribution of our energy consumption over the past three years. 
The graphs on the left illustrate our energy consumption over the last three years. It is clear that there have been no significant fluctuations in consumption, despite increases in both revenue and employee numbers during this period. This is primarily because we have heated the same office and warehouse facilities throughout the entire period. 
202220232024
Energy consumption
247
260
242
Energy consumption from fossil sources
222
237
216
The table on the right details the energy consumption in MWh from 2022 to 2024. Although our total energy consumption in 2024 is the lowest in the period, the share of renewable energy has also decreased. This is related to the fact that our electricity consumption – currently our primary source of renewable energy – was lower in 2024. 
Virksomhedslogo
CO₂e Emissions 
This section presents our CO₂e emissions for 2024, compared with figures from 2022 and 2023. The calculations have been carried out using the Danish Business Authority’s Climate Calculator and are aligned with the internationally recognised Greenhouse Gas Protocol (GHG Protocol). The first four data fields show emissions exclusively for 2024. 

CO2e scope 1

37.5Exact number: 37.54549936020408

ton

2024

CO2e scope 2 location-based

4.73Exact number: 4.726396851908525

ton

2024

CO2e scope 2 market-based

15.7Exact number: 15.690574655227069

ton

2024

The company's total location-based CO2 emissions

56.0Exact number: 56.005009482287754

ton

2024

The graphs clearly illustrate that the majority of our emissions fall under Scope 1, which is primarily due to our vehicle fleet, currently consisting mainly of fossil-fueled cars. To reduce this footprint, we are actively working towards gradually transitioning our fleet to electric vehicles by 2030. This initiative is central to our Scope 1 reduction efforts. 
202220232024
The company's total location-based CO2 emissions
52.2
60.0
56.0
The company's total market-based CO2 emissions
60.2
69.6
67.0
CO2e scope 1
33.4
40.7
37.5
CO2e scope 2 location-based
6.38
4.97
4.73
CO2e scope 2 market-based
14.4
14.6
15.7
From 2023 to 2024, we have achieved an overall reduction in CO₂e emissions, particularly within Scope 1. This improvement is largely the result of a stronger focus on prioritizing hybrid vehicles over purely fossil-fueled cars when making new acquisitions. We acknowledge that further measures are needed to meet our long-term climate goals, and we are continuously working to identify new opportunities for reduction across the entire company. 
Virksomhedslogo

CO₂e Footprint per Employee:  

We consider it important to monitor our CO₂e footprint per employee, as it provides insight into how we as a company and as individuals contribute to our overall climate impact — even during periods of growth. Below is the development of our CO₂e emissions per employee, measured in tons of CO₂e: 

  • 2022:
    Market-based emissions: 2.87 tons CO₂e
    Location-based emissions: 2.49 tons CO₂e

  • 2023:
    Market-based emissions: 3.03 tons CO₂e
    Location-based emissions: 2.61 tons CO₂e

  • 2024
    Market-based emissions: 2.39 tons CO₂e
    Location-based emissions: 2.00 tons CO₂e
These numbers demonstrate a positive trend, with a reduction in CO₂e per employee from 2023 to 2024, reflecting the company’s focus on more sustainable initiatives . 


CO₂e Relative to Revenue: 

We also track our CO₂e emissions relative to revenue to ensure that our growth occurs with a reduced environmental impact per unit of turnover. Both market-based and location-based data show a significant decrease in CO₂e intensity over time, supporting our efforts to make the business more climate-friendly. The figures are presented in the table below: 
Virksomhedslogo

Biodiversity-sensitive locations

0.00


2024

Biodiversity-sensitive area

0.00

m²

2024

Biodiversity 
At present, we have not implemented specific initiatives targeted at biodiversity, and our activities do not take place in or around vulnerable natural areas. Therefore, biodiversity is not a significant impact factor in our current operations.

However, we are open to contributing to biodiversity-enhancing initiatives in the future—either at our own locations, for example by increasing natural elements in outdoor areas, or through partnerships with relevant stakeholders. As our ESG efforts evolve, we will continuously assess where it makes the most sense and adds the greatest value for us to engage.
Biodiversity – Continued
 Below is an overview of our total land use, as well as the paved area.

Total use of land

0.40Exact number: 0.3964

ha

2024

Total sealed area

1,001

m²

2024

Nature-oriented area on-site

0.00

m²

2024

Nature-oriented area off-site

0.00

m²

2024

Virksomhedslogo

Water consumption

89.8

m³

2024

Recycled or reused water

0.00

liter

2024

Water consumption
Our water consumption is limited and primarily related to regular office operations, as we do not have any water-intensive processes within the company. Usage largely depends on the number of employees physically present at our locations and will therefore vary with office occupancy.

We recognize that water is a vital resource, and although our overall consumption is relatively low, we continuously monitor opportunities to reduce unnecessary usage — for example, through behavioral changes and facility optimizations.
Water consumption - Historically
The graphs below provide an overview of our water consumption from 2022 to 2024, as well as our water intensity. 
As shown, our total water consumption has increased over the past few years. This increase is primarily due to the growth in the number of full-time employees, from 21 in 2021 to 28 in 2024. 
When looking at the company’s water consumption relative to revenue, i.e., water intensity, the trend is more stable. This indicates that water usage is more closely linked to the number of employees than to the size of the revenue. . 
Virksomhedslogo
Resource Consumption, Circularity, and Waste Management 
At Globe Systems A/S, we have been working with the principles of circular economy for several years, with a particular focus in recent years. This stems from both our desire to contribute to a more resource-efficient society and the increasing regulatory requirements in this area.

Initiatives and Focus Areas
We actively work to reduce waste and extend product lifespans, including through:
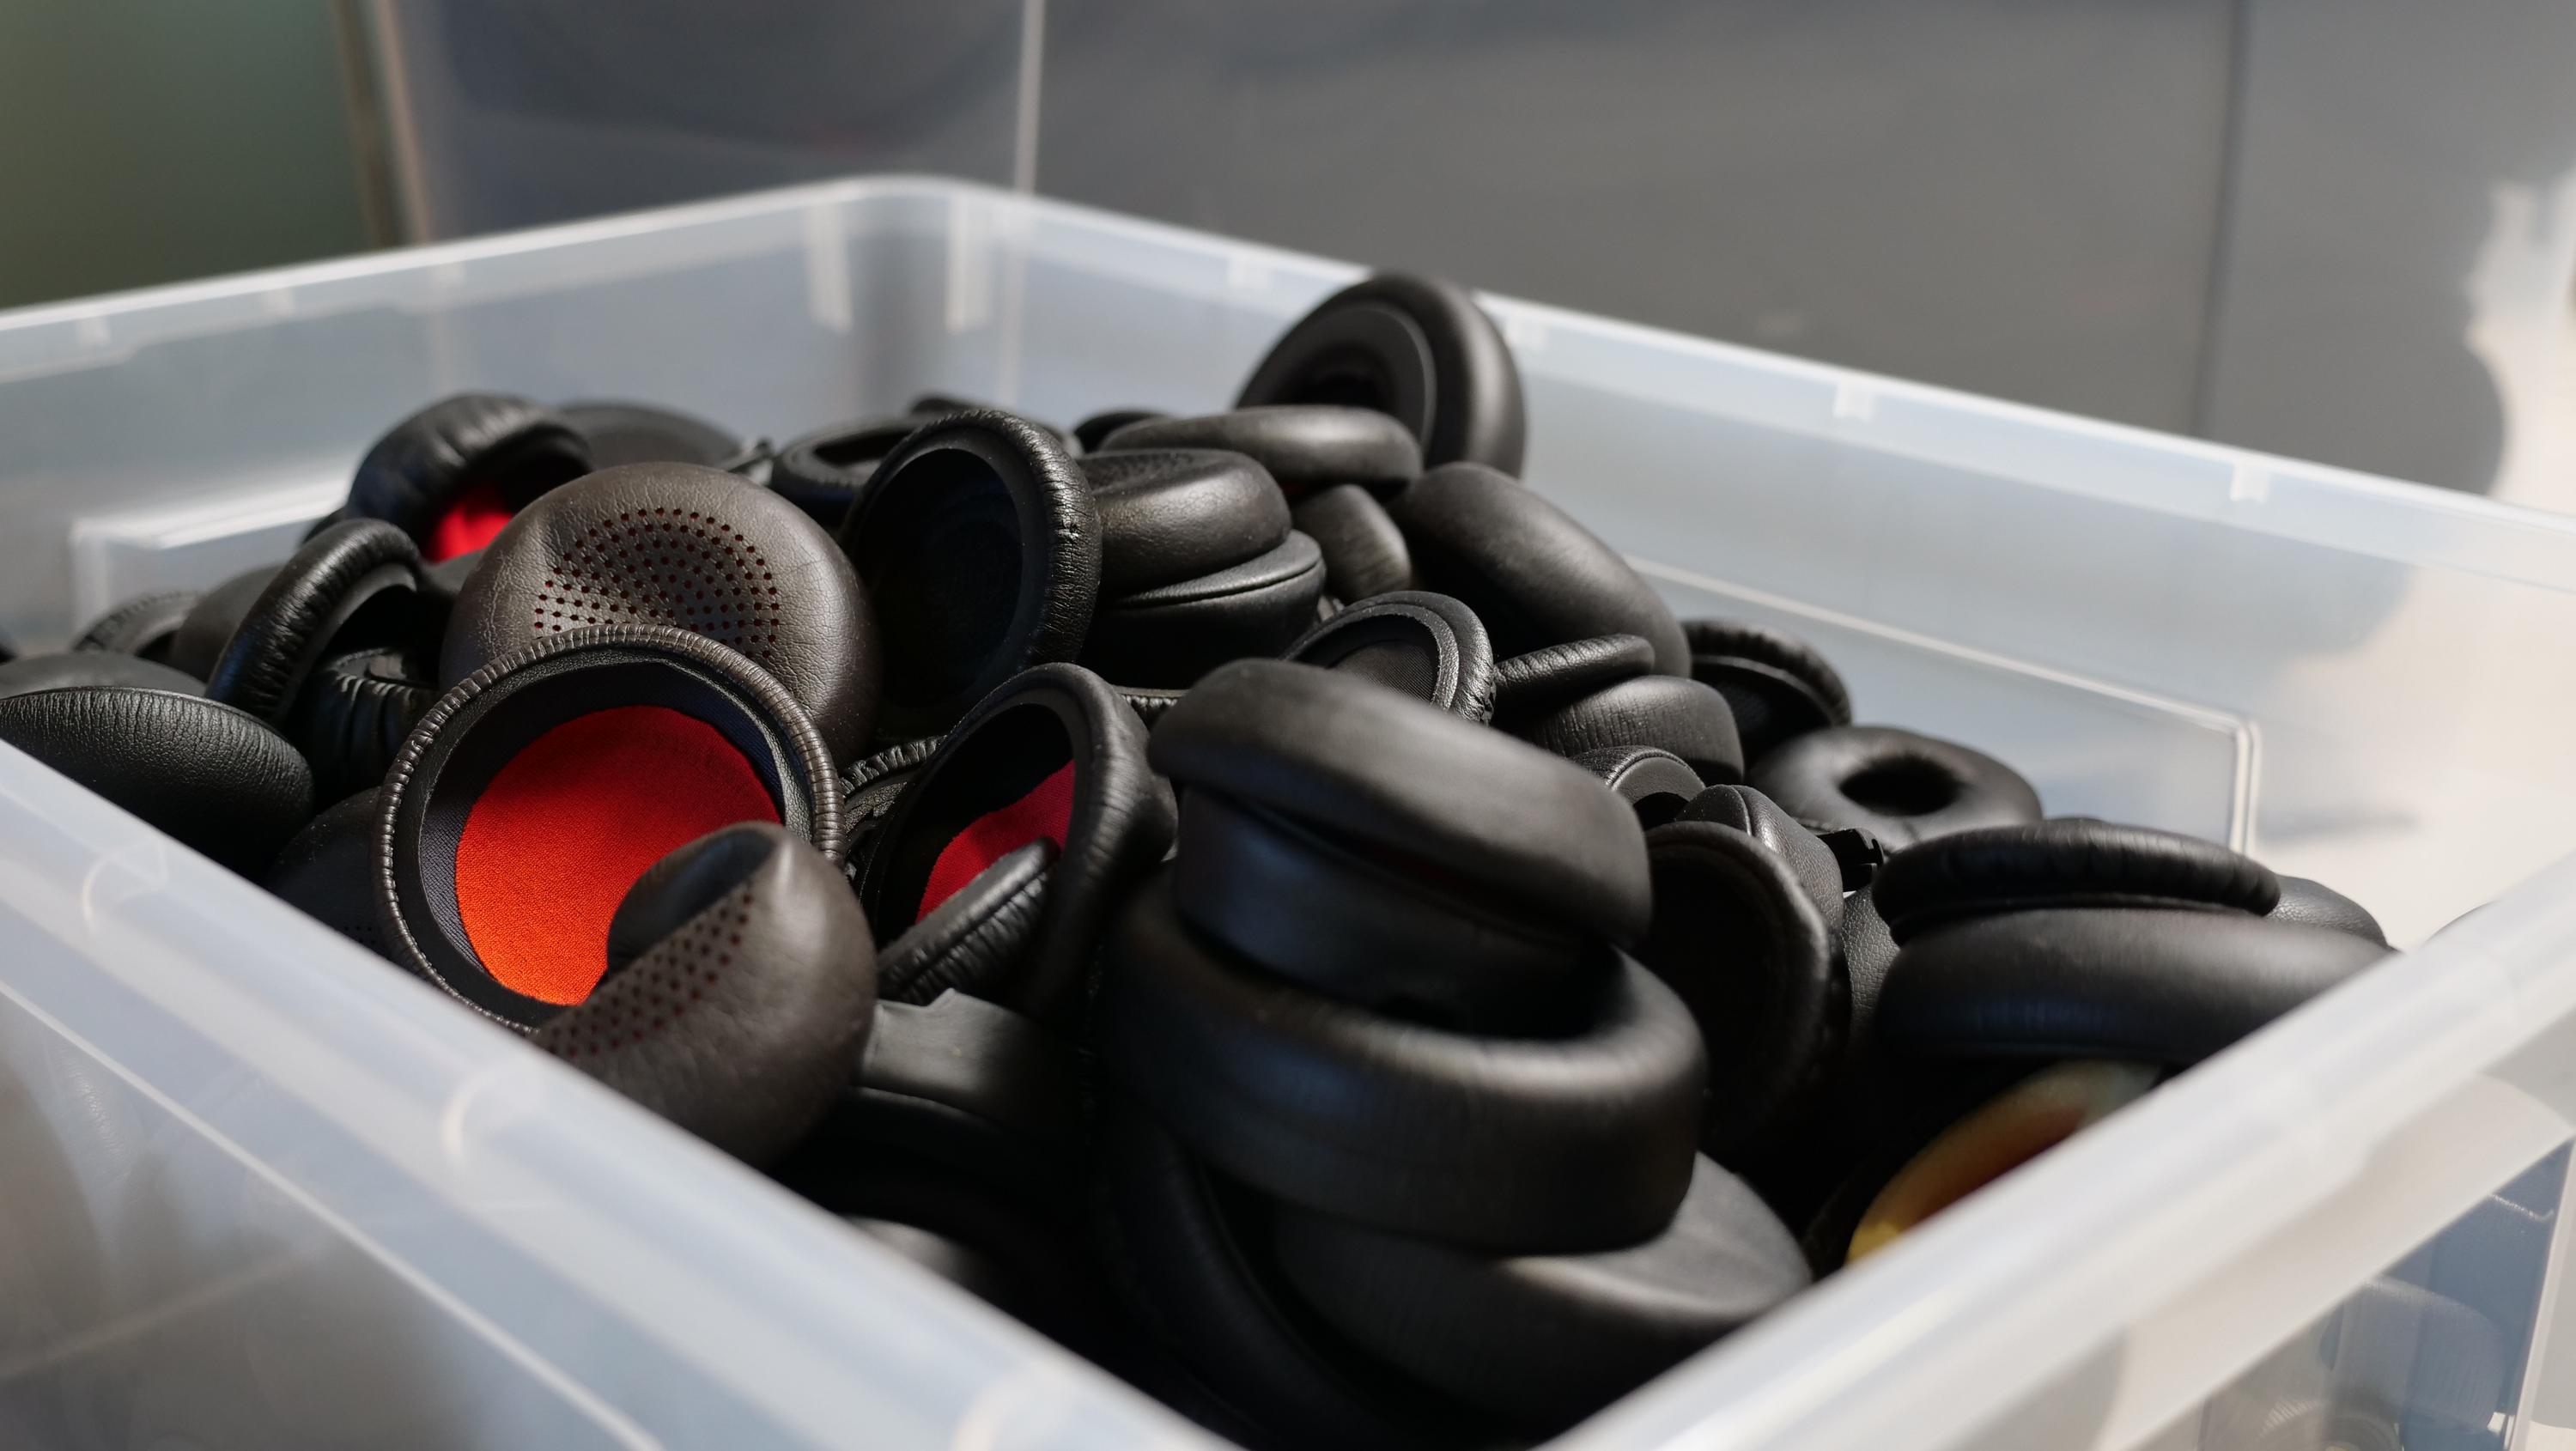
  • Product maintenance and spare parts: We continuously offer service and replacement of wear parts such as batteries, cables, and ear pads, so products can be used longer instead of being replaced.
  • Waste sorting and recycling: We sort our waste into relevant fractions for recycling, including cardboard, electronic waste, hazardous waste, and food waste. Cardboard is the largest waste category and is prepared for external recycling.
  • Circular business models: Our Globe Systems Refurb program contributes to reusing used IT equipment that would otherwise be discarded.
Waste Volumes and Management
In 2024, we generated a total of 14,586 kg of waste, with a large proportion consisting of cardboard. Hazardous waste such as electronic scrap is handled and sorted separately to enter certified recycling processes. We also sort food waste, which is collected and sent for composting, where it is recycled as soil improvement.
We continuously work to improve our data collection and reporting in this area to systematically monitor developments and set concrete reduction targets going forward.

Amount of waste generated

14,586

kg

2024

Amount of hazardous waste generated

991

kg

2024

Amount of waste prepared for recycling

8,087

kg

2024

Amount of waste reused

0.11

kg

2024

There is a clear increase in the amount of waste generated from 2023 to 2024. This increase is due to a combination of factors. First and foremost, it is driven by higher purchasing and sales volumes, which require more packaging. Additionally, our number of employees has grown, and lastly, we have started collecting electronic waste on behalf of our customers, which would otherwise have been discarded. The purpose of this is to reuse as much of the products as possible. 
202220232024
Amount of waste generated
5,269
7,677
14,586
Amount of hazardous waste generated
9.00
2.00
991
Amount of waste reused
0.00
0.00
0.11
Amount of waste prepared for recycling
2,885
4,338
8,087
 
The table above shows in numbers how the quantities have changed over time.
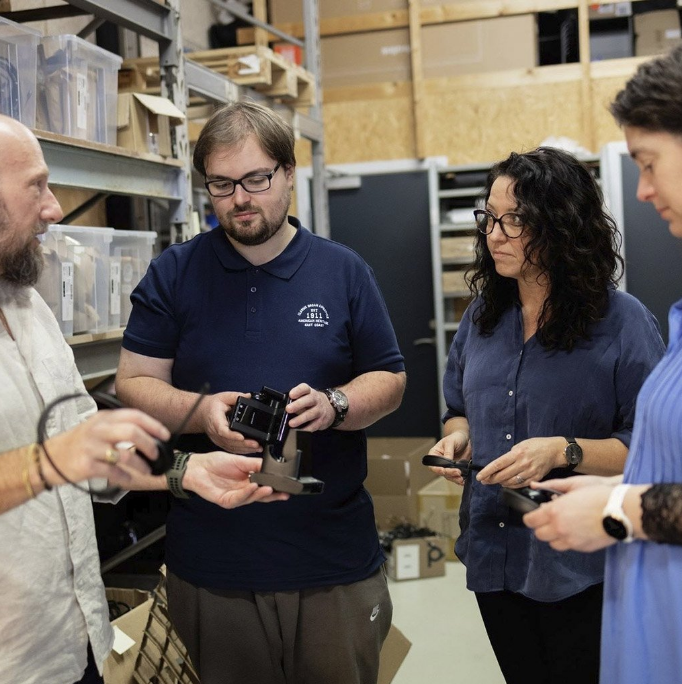
 The significant increase in hazardous waste is primarily due to the introduction of our Globe Systems Refurb program, where we collect products that would otherwise have been discarded. After collection, everything that can be reused is sorted out, while the remaining waste is sorted and then either recycled or incinerated. 
Virksomhedslogo

Full-time employees

28.0


2024

Departed employees

1.78


2024

Employee turnover

6%Exact number: 6.357142857142857%

2024

Workforce
Below is an overview of the number of full-time employees, the number of employees who have left the company, and the employee turnover during 2024.
From 2022 to 2024, we have not employed any staff on temporary contracts.
Furthermore, there have been no work-related accidents or fatalities during the same period. 
Virksomhedslogo

Employees broken down by gender

21.7


2024

Employees broken down by gender

6.42


2024

Gender pay gap

Gender pay gap

1.60

Men : Women

2024

Workforce and Compensation Structure
Our workforce currently consists predominantly of male employees, reflecting recruitment patterns in the IT and technology sector in general. However, we are aware of the importance of gender diversity and have in recent years focused more on broader recruitment to ensure our organization better reflects the composition of society over time.

Regarding compensation structure, we measure the difference between the average salaries of women and men across the organization. The current pay gap is primarily due to differences in seniority and job categories, as many of our female employees have been recruited in recent years. We continuously monitor the development of the pay gap and will strengthen our focus on equal pay principles as we further professionalize our HR data and processes.

We are also aware that gender is only one dimension of diversity, and we strive to create an inclusive work environment that embraces a wide range of ages, backgrounds, and skills. 

Virksomhedslogo

Ratio between starting salary and minimum wage

1.02Exact number: 1.020932794711715


2024

CEO salary discrepancy

1.89

CEO : Employees

2024

Employees covered by collective bargaining agreements

0%

2024

Compensation & Collective Agreements
We strive to offer fair and competitive compensation packages that reflect employees’ roles, responsibilities, and market conditions. Our starting salaries are above the industry’s applicable minimum wage, and we regularly evaluate salary levels against both market benchmarks and internal factors.

Currently, none of our employees are covered by a collective bargaining agreement, as Globe Systems A/S is not a unionized company. However, we adhere to guidelines and recommendations from the Confederation of Danish Industry (Dansk Industri) to ensure that employment terms—such as vacation, pension, working hours, and notice periods—meet standard industry practices.

We also report the ratio between the average employee salary and the CEO’s salary to maintain transparency regarding internal pay disparities. This pay ratio will be monitored and evaluated as part of our ongoing ESG data reporting 

Virksomhedslogo

Average number of hours female employees have received training

2.00


2024

Average number of hours male employees have received training

2.00


2024

Sick leave

Sick leave

4.57

7.4 Days/FTE

2024

Education and Sick leave

In recent years, all employees have participated in continuing education, with a minimum of 2 hours of mandatory professional development annually, covering leadership, technical skills, and personal competencies. We continuously work to foster a strong learning culture where employees’ individual wishes and needs play a central role, and we focus on creating flexible frameworks for further education.

At present, we have chosen not to set an overall target for training hours, as we want to tailor efforts to each employee’s development opportunities and the company’s needs. We plan to monitor employee satisfaction and learning outcomes through regular evaluations.

Regarding sick leave, our average absence rate is 4.57 days per employee per year, which aligns with national and industry averages. We actively work on well-being and health promotion initiatives to ensure a good working environment and to prevent illness.
Virksomhedslogo

Men on the board

3


2024

Women on the board

1


2024

Presence at board meetings

100%

2024

Responsible Leadership 
At Globe Systems A/S, responsible leadership is a core part of our business operations. Our board of directors and leadership team actively work to ensure that the company’s values—ambition, community, freedom with responsibility, and openness and trustworthiness—are reflected in both strategic decisions and daily operations.
We continuously measure employee and leadership engagement through annual surveys, which are integrated into our leadership dialogues and development plans. This ensures that management not only communicates our corporate DNA but also lives it in practice. Our board actively participates in ESG-related decisions and ensures responsible governance, contributing to a transparent and engaged organization at all levels. 
Virksomhedslogo
Workforce and Compensation – Historical Overview 
Below is an overview of how our workforce has developed over the past three years. 
The graphs on the left provide an overview of the growth in our workforce from 2022 to 2024. It is clear that we have increased the number of employees over the past three years. However, the gender distribution remains imbalanced, with only minimal changes observed. 
202220232024
Full-time employees
21.0
23.0
28.0
Gender pay gap
1.53
1.55
1.60
CEO salary discrepancy
1.80
1.75
1.89
Ratio between starting salary and minimum wage
1.02
1.03
1.02
Number of recordable work-related accidents
0.00
0.00
0.00
Employees broken down by gender
17.6
18.7
21.7
Employees broken down by gender
3.08
4.51
6.42
Departed employees
0.07
1.03
1.78
The table on the right illustrates how various key factors, as previously described, have evolved over the last three years. Although we are not covered by a collective bargaining agreement, it is noteworthy that our starting salaries have consistently been above the industry minimum level. In addition to the increase in the number of full-time employees, compensation and employment conditions have remained relatively stable during this period. 
Virksomhedslogo

Convictions for the violation of anti-corruption and anti-bribery laws

0.00


2024

Confirmed cases of corruption

0.00


2024

Corruption and Bribery 
In the period from 2022 to 2024, we have had no recorded instances of corruption or bribery. We remain committed to maintaining a culture of integrity and transparency, and we continuously evaluate our processes to prevent the risk of corruption. 
Virksomhedslogo
UN Sustainable Development Goals
The UN Sustainable Development Goals (SDGs) are designed to guide global efforts toward a more sustainable future by 2030 — benefiting both people and the planet. At Globe Systems A/S, we have identified a number of goals that we have chosen to focus on in particular. Below is an overview of the selected goals, followed by a description of how we actively work to integrate them into our daily operations.
Good Health and Well-Being

Good Health and Well-Being

We must ensure a healthy life for everyone and promote well-being for all age groups

Quality Education

Quality Education

We must ensure everyone has equal access to quality education and promote everyone's opportunities for lifelong learning
Affordable and Clean Energy

Affordable and Clean Energy

We must ensure that everyone has access to reliable, sustainable, and modern energy at an affordable price
Decent Work and Economic Growth

Decent Work and Economic Growth

We should promote sustained, inclusive, and sustainable economic growth, full and productive employment, and decent work for all
Industry, Innovation and Infrastructure

Industry, Innovation and Infrastructure

We must build robust infrastructure, promote inclusive and sustainable industrialization, and support innovation
Responsible Consumption and Production

Responsible Consumption and Production

We need to ensure sustainable consumption and production
Climate Action

Climate Action

We must act quickly to combat climate change and its consequences

UN Sustainable Development Goals – Detailed Focus
Goal 3 – Good Health and Well-being
We prioritize both physical and mental well-being among our employees. In 2024, we conducted a mental health survey in which 85% reported satisfaction with their work-life balance. Our flexible work model, based on the value of “freedom with responsibility,” allows employees to adapt their working hours to fit their personal needs. We aim to increase employee well-being scores by 5% by 2026 through ongoing monitoring and enhanced health initiatives.

Goal 4 – Quality Education
We invest in continuous professional and sustainability-related education for all employees. In 2024, each employee completed an average of at least 2 hours of further training. By 2030, we aim to increase the total hours allocated for continuing education, tailored to individual development opportunities and company needs, and to include sustainability training as a permanent part of the program. We also support apprentices and interns through structured onboarding, which we evaluate annually for quality and relevance.

Goal 7 – Affordable and Clean Energy
We use 100% green electricity at our headquarters in Hinnerup and are working to extend this to our second location by 2027. We have begun transitioning our vehicle fleet to electric vehicles, aiming for a 100% electric fleet by 2030. Additionally, we continuously optimize energy use through LED lighting and motion sensors.

Goal 8 – Decent Work and Economic Growth
We ensure decent working conditions throughout our value chain by requiring suppliers to comply with our Code of Conduct or equivalent standards. By 2025, we aim to audit 60% of our primary suppliers with a focus on working conditions and ethics, and expand coverage to 90% by 2030. Internally, we monitor salaries and employment conditions to ensure fair and competitive terms.

Goal 9 – Industry, Innovation, and Infrastructure
We drive innovation with a strong sustainability focus. In 2024, our Globe Systems Refurb program extended the lifespan of over 2,000 IT products, contributing to the reduction of electronic waste. Our “Sammenpak” initiative has helped reduce packaging and transport needs, although the exact CO₂e savings have not yet been calculated. We also promote increased use of AV solutions, which in 2024 contributed to a reduction in physical meetings. However, we do not have precise data on the actual reduction in our customers' travel.

Goal 12 – Responsible Consumption and Production
We actively work with circular economy principles and responsible resource use. Our waste sorting ensures that 56.7% of the company’s waste is properly recycled. The Globe Systems Refurb program only replaces necessary parts to extend product lifespans. In 2025, we plan to implement supplier assessments to ensure that no partners operate in high-risk areas or use illegal mining practices.

Goal 13 – Climate Action
We are committed to reducing our climate footprint. In 2024, we achieved a total energy reduction of 7% through energy-saving measures such as LED lighting and motion sensors. We have switched 100% of the electricity at our headquarters to green energy. Our vehicle fleet is being transitioned to electric, with the goal of reaching 100% electric vehicles by 2030. We continuously monitor our CO₂ emissions and set concrete reduction targets in line with company growth.

Virksomhedslogo
Closing Remarks and Focus Areas for 2025 
With this report, we aim to provide a transparent insight into how sustainability has become an integrated part of our strategy and daily operations. We work systematically to identify, measure, and reduce our environmental and social impacts, with a strong emphasis on documenting our CO₂e emissions, energy consumption, working conditions, and other key ESG areas.
Throughout the reporting period, we have implemented a number of concrete initiatives that reflect our ambition to combine business growth with social responsibility. These include the partial transition of our vehicle fleet to hybrid cars, the use of green electricity, an updated Code of Conduct for suppliers, the launch of our Refurb program and Consolidated packaging concept, as well as improvements in employee well-being and professional development.
We recognize that the path toward a more sustainable business requires continuous improvement and clear prioritization. In 2025, we will strengthen our efforts within circular initiatives, including increasing the visibility of the Refurb program among our customers and gradually transitioning our fleet to electric vehicles. At the same time, we will continue to focus on energy optimization, enhancing data quality, and engaging employees in the green transition.
We view this report as a key tool for tracking our progress and holding ourselves accountable to the goals we have set. We will continuously evaluate our efforts to ensure they deliver real value – for the company, our customers, employees, and society at large.
Virksomhedslogo
Appendix 1 – Summary of Baseline Data
The following provides a comprehensive overview of all VSME Basis Baseline data from 2022, 2023, and 2024 

Introduction to the company

202220232024
Bæredygtighed indgår i vision, strategi eller værdigrundlag
We are not working on sustainability, but we plan to do so in the future
We are working on sustainability, but it is not written into our vision, strategy, or values foundation.
Sustainability is written into our vision, strategy, or values.
Virksomheden har sat mål for sit arbejde med bæredygtighed
We have chosen some focus areas, but we have not defined them as goals
We are working on defining goals
Virksomheden arbejder i det daglige med at integrere bæredygtighed
No
Yes
Yes
Virksomheden kommunikerer internt om ansvarlighed indenfor miljø og klima
No
Yes
Yes
Virksomheden kommunikerer eksternt om ansvarlighed indenfor miljø og klima
No
No
Yes

Master Data (B1)

202220232024
Selskabsform
Public limited company (A/S)
Balancesum
85,280,271DKK
51,426,006DKK
63,457,807DKK
Fuldtidsansatte (FTE)
21.0
23.0
28.0

Practices, policies and future initiatives for transitioning towards a more sustainable economy (B2)

202220232024
Politikker eller initiativer for områder der bidrager til bæredygtig omstilling
Pollution, Circular economy
Pollution, Consumers and end users, Climate change, Circular economy
Pollution, Corporate governance, Consumers and end users, Climate change, Circular economy
Offentligt tilgængelige politikker
Circular economy
Consumers and end users, Circular economy
Politikker med mål
Ingen
Circular economy
Corporate governance, Circular economy
Fremtidige initiativer
Circular economy
Not reported
Not reported

Energy consumption (B3)

202220232024
Energiforbrug
890,396MJ
936,466MJ
871,074MJ
Energiforbrug fra fossile energikilder
798,678MJ
853,456MJ
776,840MJ
Energiforbrug fra vedvarende energikilder
173,803MJ
168,577MJ
152,575MJ

CO2 (B3 - continued)

202220232024
Virksomheden ønsker at opgøre og udregne deres CO2
Yes
Yes
Yes
CO2e scope 1
33.4ton
40.7ton
37.5ton
CO2e scope 2 lokationsbaseret
6.38ton
4.97ton
4.73ton
Lokationsbaseret CO2-intensitet
~0.00ton/DKK
~0.00ton/DKK
~0.00ton/DKK

Biodiversity (B5)

202220232024
Sårbare lokationer
0.00
0.00
0.00
Sårbart areal
0.00m²
0.00m²
0.00m²
Samlet arealforbrug
4,051m²
4,051m²
3,964m²
Befæstet areal
1,088m²
1,088m²
1,001m²
Naturorienteret område inden for anlægsområdet
0.00m²
0.00m²
0.00m²
Naturorienteret område uden for anlægsområdet
0.00m²
0.00m²
0.00m²

Water (B6)

202220232024
Vandforbrug
60.0m³
66.0m³
89.8m³

Resource use, circular economy and waste management (B7)

202220232024
Mængde affald genereret
5,269kg
7,677kg
14,586kg
Mængde farligt affald genereret
9.00kg
2.00kg
991kg
Mængde affald gjort klar til genanvendelse
2,885kg
4,338kg
8,087kg
Mængde affald genbrugt
0.00kg
0.00kg
0.11kg
Der anvendes principper for cirkulær økonomi
Yes
Yes
Yes
Der drives processer, der involverer væsentlige materialestrømme
Yes
Yes
Yes

Workforce (B8)

202220232024
Mandlige fuldtidsansatte i virksomheden - Men
17.6
18.7
21.7
Kvindelige fuldtidsansatte i virksomheden - Women
3.08
4.51
6.42
Forladende medarbejdere
0.07
1.03
1.78
Medarbejderomsætning
0.33%
4.48%
6.36%
Fastansatte i fuldtidsækvivalenter
21.0
23.0
28.0
Midlertidigt ansatte i fuldtidsækvivalenter
0.00
0.00
0.00

Health and safety (B9)

202220232024
Antal arbejdsulykker
0.00
0.00
0.00
Arbejdsulykker pr. 100 ansatte
0.00per 100 FTE
0.00per 100 FTE
0.00per 100 FTE
Antal registrerede dødsfald som følge af arbejde
0.00
0.00
0.00

Remuneration, collective bargaining and training (B10)

202220232024
Ansatte der er dækket af kollektive overenskomster
0.00%
0.00%
0.00%
Gns. efteruddannelsestimer for mandlige ansatte
2.00
2.00
2.00
Gns. efteruddannelsestimer for kvindelige ansatte
2.00
2.00
2.00
Forholdet mellem startløn og minimumsløn
1.02
1.03
1.02

Convictions and fines for corruption and bribery (B11)

202220232024
Domfældelser for korruption og bestikkelse
0.00
0.00
0.00
Beløb af bøder for korruption og bestikkelse
0.00DKK
0.00DKK
0.00DKK
202220232024
Virksomheden er underlagt miljøgodkendelse
No
No
No
Virksomheden har politik for at reducere forurening
No
No
Yes
Virksomhedslogo
Appendix 2 – Summary of ESG Indicators 2024 
Environment (Environment)ValueUnitPeriod
Total CO2e emissions in scope 137.5ton2024
CO2e emissions from scope 2 location-based4.73ton2024
CO2e emissions from scope 2 market-based15.7ton2024
Total CO2e emissions in Scope 313.7ton2024
Energy consumption871,074MJ2024
Share of energy consumption from renewable energy sources17.5%2024
Water consumption89.8m³2024
Social (Employees)ValueUnitPeriod
Average number of full-time employees28.02024
The proportion of women among full-time employees22.9%2024
Percentage of women in top managementNot reported
Gender pay gap1.602024
Employee turnover6.36%2024
Sick leave according to the latest assessment4.577.4 Days/FTE2024
Customer retention rateNot reported
Governance (Governance)ValueUnitPeriod
Number of women on the company's board of directors12024
Number of men in the company's board of directors32024
Presence at board meetings100%2024
Pay gap between CEO and employees.1.892024

Comments on the report

The report is not verified by an independent third party. Although we have made efforts to ensure that the content of the report is accurate, there is no guarantee regarding its accuracy and/or completeness, and we therefore disclaim any liability for any damage or loss that may arise from actions taken on the basis of the report.

Valified
This ImpactReport is made with Valified